Overall Analysis
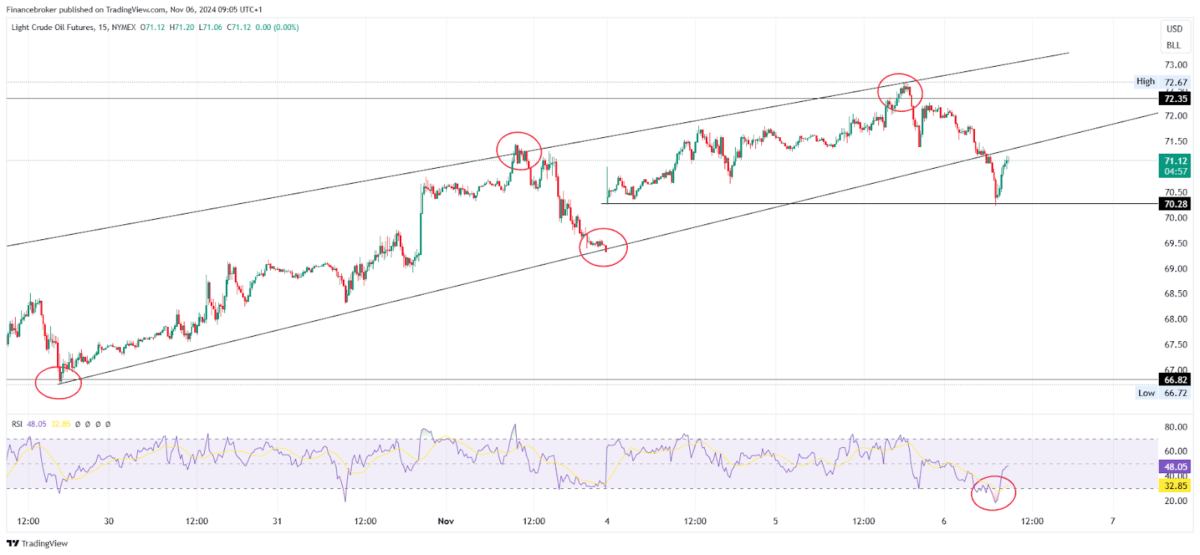
Oil breaks its channel downwards, and 70.28 acts as a final support.
A breakdown of natural Gas in a sideways zone can lead to selling till support. Fewer moments are expected in the instrument.
Oil Chart Analysis
Oil/USD 15-Minute Chart (Source: TradingView)
On the 5th Nov 2024 trading session, oil initially showed sideways momentum. In the second half, the buy-side rally was seen but eventually rejected and closed near the opening price. In the second half session, volatility was visible.
Looking at the price in the 1-hour time frame, the price can be seen moving in the channel, respecting both support and resistance. On the 5th Nov trading session price reversed from the 72.67 level, which was the resistance zone. Currently, on the 6th Nov trading session price broke the supporting trendline but took support from the 4th Nov opening price of 70.28.
In the 15-minute time frame price broke the support level with a sharp fall till the 4th Nov opening price of 70.28; the price can be seen respecting the support level and went back up. RSI is in an oversold scenario. Hence, reversal and retest of trendlines are expected.
If we’re looking for an entry trigger, a few are mentioned below.
If the price breaks the 70.28 level and sustains below it, then sell-side entry can be with stop loss above the previous swing high and target till 69.40 level.
If the price enters back in the channel, buy-side entry can be made with a stop loss below the previous swing low, but the target will be 72.35 and rest on a trailing basis.
Natural Gas Chart Analysis
Gas/USD 15-Minute Chart (Source: TradingView)
Natural Gas was highly volatile on the 5th Nov 2024 trading session. It moved sideways in the first half but fell sharply to -3.25% after a bit of recovery.
On a daily time frame, Natural gas is currently making a peanut pattern. Resistance and support are tested thrice. Price is squeezing as it moves towards the end of the pattern. The pattern breaks any of the sides and sustains above it so that entry on a daily time frame can be planned.
Natural Gas, on a 15-minute time frame, is currently sustaining above 0.5 fib retracement level of the previous swing. Since the beginning of the 6th Nov trading session, the price has held a 0.5 level.
If you’re looking for an entry, consider planning a sell-side entry if the price closes below the 2.7605 level. Set a stop loss above the previous swing high, with a target at the 2.6920 level.
The post Oil Breaks Support at 70.28; Gas in Sideways Trading Zone appeared first on FinanceBrokerage.


